Quantcast
Channel: nProbe – ntop
Viewing all 108 articles
Browse latest View live

Learning The ntop World of Apps

$
0
0

The main criticism to ntop is the lack of documentation. This is because we have to maintain many projects, have little time, and also because we prefer coding to documentation. We decided to fill this gap and give a positive answer to your requests:

  • We have created the nBox GUI to enable you to use all our applications without the pain of compiling and configuring them. This is a free product that everyone can use to build their own measurement gear or just to start ntop using a web browser.
  • We have refreshed all manuals and tried to include all your comments.

You can find all the documentation in the section Documentation of this web site and in particular:

We plan to soon write the nDPI manual and start working at ntop. Be patient.

As usual we await your comments and feedback. We apologise once again for you waiting so long.


Tracking and Troubleshooting Mobile Phone Users (IMSI) using the MicroCloud

$
0
0

The microcloud is one of the fields where s used extensively by mobile network operators. The reasons are manyfold:

  • Data aggregation facilities offered in realtime by the microcloud.
  • Realtime user-to-tunnel mapping.
  • User traffic-to-user correlation.

Unfortunately when a mobile network is populated by million of active users (IMSI), troubleshooting a problem can be a problem. Tools such as wireshark that are used on fixed networks do not work because:

  • The network is distributed, so there is not single sniffing point, but rather it is necessary to deploy our tools across the network that might mean “across a whole country”.
  • There is so much ingress traffic (multi-10 Gbit with modern LTE/4G networks).
  • Traffic is encapsulated in GTP tunnels that will then contain user traffic, so simple BPF filters won’t work.

For this reason we have developed some tools and nProbe extensions that simplify operations.

How to Dump an IMSI traffic on a pcap file

PF_RING comes with a tool named pfwrite that is a simple packet-to-disk tool (in essence it is a very entry-level version of n2disk). Tracking a user/IMSI on a mobile network is a quite dynamic activity as users move, and connect/disconnect from the mobile network. In essence it is like if a PC would change IP addresses several times during the day. We have enhanced nProbe to publis onto the microcloud when a IMSI user changes status so that we can track it.

pfwrite

 Supposing to start nProbe as follows (note that you usually you need to start several nProbe instances in order to monitor a large network, each monitoring a portion o the traffic)

nprobe --tunnel --gtpv1-dump-dir /var/gtpv1/ --redis localhost --ucloud -i dna0

nProbe will publish into the microcloud information about IMSI that connected/disconnected from the mobile network. pfwrite needs to be deployed onto a location where user traffic flows and it is started as

pfwrite -m <IMSI to track> -w imsi.pcap

As soon as it is started up, it will connect to the microcloud (local node) and fetch the GTP tunnels (if known) for the specified IMSI. Then will spawn a thread that subscribes to the microcloud and listens for events concerning the specified IMSI. This way this tool is able to dump on disk the packets of the specified IMSI independently of its status (connected or disconnected from the mobile network) and more important, it is tracked while it changes its status over time. This without restarting the tool, but just exploiting the messages published by nProbe into the microcloud.

Realtime Layer-7 IMSI Traffic Aggregation

nProbe now support an addition flag

--imsi-aggregation

(For instance: nprobe --tunnel --gtpv1-dump-dir /var/gtpv1/ --redis localhost --ucloud -i dna0 --imsi-aggregation)

that instructs nProbe to aggregate traffic per IMSI/Application protocol onto the microcloud in realtime with 5 minutes aggregation granularity. This means that whenever a flow is expired, nProbe updates the counter for the flow protocol and the IMSI that has generated the flow.

IMSIAggregation

Through a companion tool, it is possible to put onto crontab the following entry

$ crontab -l|grep ggrega
*/5 * * * * /home/imsi/imsiAggregator.py --redis localhost  --epoch -2 --outdir /export/working_dir/imsi

that walks the micrcloud every 5 minutes and dumps traffic on disk in text format as follows

#
# Timestamp IMSI Granularity Protocol Packets Bytes Flows Duration(sec)
#
1374938100 XXXXX2001106796 300 Unknown 3 298 2 2
1374938100 XXXXX1100485374 300 HTTP 393 283553 13 114
1374938100 XXXXX2001110729 300 SSL 49 14269 10 18
1374938100 XXXXX2001338233 300 Skype 15 1411 1 7
1374938100 XXXXX1101335045 300 DNS 2 385 1 1
1374938100 XXXXX2001931139 300 Viber 17 1487 4 35

Note that we do not have just the number of bytes per IMSI, but also the application protocol discovered by nDPI. In essence you can answer questions like “who’s using Viber on my mobile network?” of “how many active subscribers use Facebook?”.

Conclusion

These are just two examples of what you can do with nprobe and the microcloud. Applications are almost infinite and in realtime. No more latency in your “monitoring answers” but rather know what is happening when it is happening. Without spending a fortune on database clusters or distributed storage infrastructure. All with the power of the microcloud.

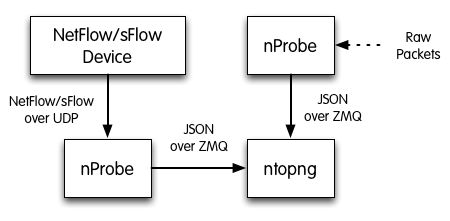
Why nProbe+JSON+ZMQ instead of native sFlow/NetFlow support in ntopng?

$
0
0

Both sFlow and NetFlow/IPFIX are the two leading network monitoring protocols used today on the market. They are two binary protocols encapsulated over UDP, with data flowing (mono-directional) from the probe (usually a physical network device or a software probe such as nProbe)  to the collector (a PC that receives traffic and handles is or dumps it on a database). This architecture has been used for decades, it still makes sense from the device point of view but not for the application (developer) point of view for many reasons:

  1. The transport in NetFlow/sFlow has been created from the point of view of the device (probe) that has to send flows to all configured collectors. This means that all collectors will receive all the flows, and that all flows (regardless of their nature) will be thus sent to all collectors. Example: if you want to send to collector A only HTTP flows, and to collector B only VoIP flows it is not possible. The probe will send everything to everyone. All the time. Imagine to have a TV that is not tuned to your favourite channel at a given time, but that shows all the channels simultaneously.
  2. UDP has limitations with MTUs. The use of VPNs (with a smaller than 1500 bytes MTU) is relatively common so probes have to deal with this problem. Another problem is that it is not possible to deliver data larger than a 1400 bytes or so into a UDP packet. This means that a large HTTP cookie won’t fit onto a UDP packet and thus that you have to cut your information up to a specific upper bound. Not nice in particular if the information must be received uncut such as URLs for instance.
  3. NetFlowV9/IPFIX (and in part sFlow too) have been created with the concept of template, so the collector must store and understand the flow template in order to decode data. This means complications, errors, retransmission of templates, and so on.
  4. Due to the need to keep NetFlow templates small in size, sending a flow that contains an email header (Subject, From, To, CC, Bcc) can become a nightmare as this flow must be divided into sub flows all linked with a unique key. Example <MessageId, To Address 1>, <MessageId, To Address 2>, … Not so nice.
  5. The collector has to handle the probes idiosyncrasies with the results that flows coming from different probes might not necessarily have the same format (or flow template if you wish).
  6. Adding new fields (e.g. the Mime-Type to a HTTP Flow) to existing templates might require extra effort on the collector side.
  7. The probe cannot send partial flows easily or periodic updates (e.g. every sec a probe sends VoIP monitoring metrics) unless further specific templates are defined.

All the above facts have been enough to let us move to a different way of shipping monitoring data from the device to the collector. The application that uses monitoring data must:

  1. Receive data ready to be used. Handling templates is old fashion and must be confined on a territory/place near the probe but this complexity should not pollute all the actors that are planning to use monitoring data.
  2. The data transport should be sitting on top of TCP, so that a probe can send arbitrary long data without having to cut this data or care of MTUs.
  3. The TCP-based transport must be connectionless, namely if the probe or the collector die/disconnect the transport will handle the problem, as well it will transparently handle a future reconnection. In essence we want the freedom of a connection-less protocol over a connection oriented probe.
  4. Monitoring data should be divided in channels/topics, so that the app that has monitoring data will publish the available channels, and the data consumers will subscribe to one or multiple channels and thus receive only the information they are interested in.
  5. The data format can change over time, new fields can be added/removed as needed. For instance if nProbe monitors a YouTube video, it should send the VideoID into the flow, but in case of non-YouTube a flow can be emitted but without such field. In NetFlow doing that means create as many templates as all the combinations, or send templates with field with empty values (but that still take space at the network transport level).
  6. Receive data on a format that is plain and easy. For instance in NetFlow the flow start time (FIRST_SWITCHED) is the “sysUptime in msec at which the first packet of this Flow was switched”.So the application is limited to ms precision and in order to know this time we must first know the sysUpTime, do some math, and compute this time. Odd and naïve I believe. If there is a field, its value must be immediately available and not precomputed based on other fields that complicate the application logic.
  7. Interpret the fields it handles, and discard those that cannot be handled as they are unknown. This grants application evolution over time so that new fields are added and only the old ones are handled by legacy apps that continue to work unmodified while new apps can also handle the new fields.

ZMQ

In order to implement all this we made some design choices:

  1. Data is shipped in JSON format. Everyone can read and understand it, and in particular web browsers. The format is human-friendly and easy to read, but in the near future we might move to compressed or binary (or both) formats for efficiency reasons. The flowField is identified by a number as specified int the NetFlow RFC (FIRST_SWITCHED is mapped to 22), and the field value is printed in string format. For instance   {8:"192.168.0.200",12:"64.243.24.160",15:"0.0.0.0",10:0,14:0,2:13,1:987,22:1379457349,21:1379457349,7:50141,11:80,6:27,4:6,5:0,16:0,17:3561,9:0,13:0} represents the flow [tcp] 64.243.24.160:80 -> 192.168.0.200:50142 [12 pkt/11693 bytes].
  2. nProbe can be used as pure probe (i.e. it convert flows into flows) or as proxy (i.e. it acts as a sFlow/NetFlow collector with respect to ntopng. In no case ntopng will receive raw flows, but only via JSON.
  3. ZMQ is a great transport that allows ntopng to connect to nProbe and fetch data via ZQM only for the topics it is interested in. Currently ntopng subscribes to “flows” topic, but in the future this will change and be configurable as more topics can be subscribed. So on the above picture the arrow from nProbe to ntopng depicts the information flow, but physically is ntopng that connects (as client) to nProbe that instead acts as data source. If nProbe or ntopng are restarted, the transport takes cares of all these issues so the apps do not see any degradation or have to explicitly reimplement reconnections.

As explained in the ntopng README file, nProbe and ntopng must be started as follows:

  1. Flow collection/generation (nProbe)
    nprobe --zmq "tcp://*:5556" -i eth1 -n none (probe mode)
    nprobe --zmq "tcp://*:5556" -i none -n none --collector-port 2055 (sFlow/NetFlow collector mode)
  2. Data Collector (ntopng)
    ntopng -i tcp://127.0.0.1:5556

This means that nProbe creates a TCP endpoint available on all interfaces (* stands for all) active at the port 5556. ntopng instead is instructed to connect via TCP to such endpoint as client (in essence it is the opposite of NetFlow/sFlow). To the same nProbe endpoint you can connect multiple probes or even a zmq listener application.

Like said before, this is just the beginning. Using the above solution we can create new apps that would be much more complicated to develop by relying just on sFlow/NetFlow.

NOTE:

  1. In order to use this solution you MUST have a recent copy of nProbe that is supported with ZMQ. If unsure please check this first (nprobe -h|grep zmq).
  2. This is an interesting thread about the use of JSON in network monitoring,
  3. We (at ntop) do not plan to discontinue sFlow/NetFlow/IPFIX support on our products. We just want to say that their complexity cannot be propagated to all apps, most of which live in web browser or are coded with modern languages whose developers like to focus on the problem (network monitoring) rather than on how data is exchanged across monitoring apps. In a way think of sFlow/NetFlow/IPFIX of a old serial port, and JSON as a USB port. You can use a serial-to-USB converter, but serial ports on PCs are now legacy. nProbe is our serial-to-USB converter, and ntopng is a USB-only app.

Using ntopng and nProbe on the BeagleBone (small is beautiful)

$
0
0

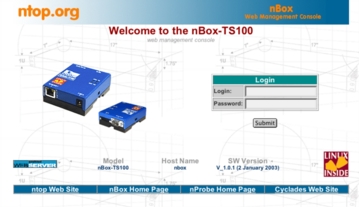
For years we enjoyed pushing the limits of our software products (our nBox recorder is able to handle multi-10Gbit interfaces for instance), but our roots are not there. All started in 2003 with this small PowerPC-based nBox

nbox-cyclades

where we have first integrated nProbe into it. Now after 10 years, it is time to rethink all this and try again. On the market there are several small and cheap platforms such as the Raspberry Pi, the BeagleBone Black and the EdgeMax that are ideal platforms for our apps. We have then decided to start our endeavour with the BeagleBone. As we plan to release a new ntopng version in the near future, we decided to refresh out software and make sure it works out-of-the-box on it.

ntop-beagle

The BeagleBone Black is a 45$ ARM-powered board fast enough to run our apps (1 GHz CPU)

beaglebone:~$ cat /proc/cpuinfo 
processor	: 0
model name	: ARMv7 Processor rev 2 (v7l)
BogoMIPS	: 990.68
Features	: swp half thumb fastmult vfp edsp thumbee neon vfpv3 tls 
CPU implementer	: 0x41
CPU architecture: 7
CPU variant	: 0x3
CPU part	: 0xc08
CPU revision	: 2

Hardware	: Generic AM33XX (Flattened Device Tree)
Revision	: 0000
Serial		: 0000000000000000

and equipped with 512 MB of RAM and 2 GB of storage. It comes with Ångström Linux and all you have to do is to compile the apps. Both nProbe and ntopng compile out of the box from source code. For sake of space we cover ntopng compilation that is more complex than nProbe to compile, due to its dependencies. The first step os to install the prerequisites as follows:

opkg install subversion libpcap rrdtool-dev
wget http://download.redis.io/redis-stable.tar.gz
tar xvzf redis-stable.tar.gz
cd redis-stable
make

Done that it is time to compile ntopng as follows

svn co https://svn.ntop.org/svn/ntop/trunk/ntopng/
cd ntopng
./configure
make

That’s all. Now you can start ntopng as you do on your Linux or Windows box.

nProbe
beaglebone:~/nProbe$ ./nprobe -v
Welcome to nprobe v.6.15.131010 ($Revision: 3730 $) for armv7l-unknown-linux-gnueabi
Copyright 2002-13 by Luca Deri <deri@ntop.org>
ntopng
beaglebone:~/ntopng$ ./ntopng -h
ntopng armv7l v.1.0.2 (r6859) - (C) 1998-13 ntop.org

Usage:
  ntopng 
  or
  ntopng [-m ] [-d ] [-e] [-g ] [-n mode] [-i <iface|pcap file>]
              [-w ] [-p ] [-P] [-d ]
              [-c ] [-r ]
              [-l] [-U ] [-s] [-v] [-C] [-F]
              [-B ] [-A ]
...

Resource usage is pretty low and there is plenty of room for running ntopng.

top - 17:37:59 up  2:00,  4 users,  load average: 0.05, 0.33, 0.58
Tasks: 114 total,   1 running, 111 sleeping,   2 stopped,   0 zombie
Cpu(s):  6.7%us,  3.8%sy,  0.0%ni, 88.8%id,  0.0%wa,  0.0%hi,  0.6%si,  0.0%st
Mem:    510820k total,   505692k used,     5128k free,    32464k buffers
Swap:        0k total,        0k used,        0k free,   337412k cached

  PID USER      PR  NI  VIRT  RES  SHR S %CPU %MEM    TIME+  COMMAND                                        
13519 nobody    20   0  114m  11m 5128 S  5.7  2.4   0:27.73 ntopng    
13550 deri      20   0  2628 1160  896 R  2.9  0.2   0:00.21 top      
13503 root      20   0 27760 1852 1116 S  0.6  0.4   0:04.10 redis-server

As future work items, after ntopng 1.1 has been released, we plan to optimise our apps for these low-cost platforms so that everyone can monitor its Internet connection at low cost without purchasing complex (to configure and maintain) and expensive devices.

We cannot tell you more, but more news will follow. Stay tuned!

PS. When used tethered the BeagleBone has 2 ethernet interfaces (you need one for management and one for receiving packets to analyse). You can add an extra ethernet interface using a USB Ethernet adapter if you need an extra monitoring port.

Running nProbe and ntopng on Ubiquity EdgeRouter Lite

$
0
0

On this blow we have already discussed on how to compile and run ntopng and nProbe on a BeagleBoard and Raspberry Pi. Now we explain (courtesy of  Shane Graham) how to achieve the same on a Ubiquity EdgeRouter Lite, a cheap yet powerful router.

First, setup the proper Debian repository:

configure
set system package repository squeeze components 'main contrib non-free'
set system package repository squeeze distribution squeeze
set system package repository squeeze url http://http.us.debian.org/debian
set system package repository squeeze-security components main
set system package repository squeeze-security distribution squeeze/updates
set system package repository squeeze-security url http://security.debian.org
commit
save
exit

Install the prerequisites for compiling nProbe:

sudo apt-get update
sudo apt-get install build-essential libtool automake autoconf

Prepare to compile:

tar zxvf nprobe_6.15.131104_svn3774.tgz
cd nprobe_6.15.131104_svn3774

Compile and install:

./autogen.sh
 make
 make dat files
 sudo make install

You can now run nProbe or compile ntopng the same way.  The platform is quite efficient and nProbe uses very little CPU cycles, much lower than other processes such as Squid used for URL monitoring.

Enjoy!

How to Balance (Mobile) Traffic Across Applications Using PF_RING

$
0
0

Traffic monitoring requires packets to be received and processed in a coherent matter. Some people are lucky enough to get all interesting packet on a single interface, but this is unfortunately not a common scenario anymore:

  • The use of network taps split one full-duplex interface into two half-duplex interfaces each receiving a direction of the traffic.
  • Standby interfaces, require traffic monitoring apps to surveil two interfaces, where traffic flows only on one interface at time.
  • Asymmetric traffic (i.e. all protocols similar to HTTP where the traffic in one direction is much more than the traffic on the opposite direction).

On top of these scenarios, there are some more that are bait more challenging:

  • Balance encapsulated traffic (i.e. IP tunnels or mobile traffic encapsulated in GTP) using the encapsulated IP or tunnel identifier.
  • Merge and then balance traffic received on multiple ingress interfaces. Eventually after merging, forward the traffic onto an egress interface.
  • Send the same ingress packet to various applications:
    • Some of which need to perform complex monitoring (e.g. nProbe with nDPI and various plugins enabled) and thus need the packet to be balanced across a pool of applications.
    • Others require packets in the same order as they have been received on the ingress interfaces (i.e. First-In-First-Out based on the ingress interfaces arrival time) and need to be strictly processed in order (e.g. n2disk that needs to dump packets on disk).

The “classic” PF_RING contains the concept of cluster. A set of applications sharing the same clusterId (e.g. 10) will balance ingress packets coming from one or more ingress interfaces. For instance take the pfcount application that receives and counts ingress packets, and suppose you want to balance traffic coming from eth1 and eth2 to three pfcount applications, then you need to start three times (this because you decided to have 3 apps, but if you need more apps, you just have to start more) the following commands:

  • pfcount -i “eth1,eth2” -c 10 -g 0
  • pfcount -i “eth1,eth2” -c 10 -g 1
  • pfcount -i “eth1,eth2” -c 10 -g 2

In essence you start multiple instances of the same application on the same clusterId (the only difference is the -g parameter that binds a specific instance to the specified CPU core). This mechanism is available also on the PF_RING DAQ for Snort that enables multiple Snort instances to share ingress traffic. Note that the PF_RING cluster:

  • Balances the traffic according to the flow (i.e. the same application sees both directions of the same connection), but you are free to set a different traffic balancing policy if you want (see pfring_set_cluster() in the PF_RING API).
  • It is GTP-friendly, so it can effectively balance ingress traffic across multiple GTP-aware applications such as nProbe.

Using DNA and libzero, we can have an even more versatile and efficient traffic balancing. As described in README.libzero, the pfdnacluster_master application implements a very versatile traffic balancing as depicted below.

DNAMasterAs shown above, it is possible to both balance and fan-out in zero copy (read as: you can handle 2x10G interfaces with no packet drop whatsoever) to multiple applications in a very versatile manner. For example the balancing depicted above is implemented with the following commands:

  • pfdnacluster_master -i “dna0,dna1,dna2” -c 10 -n 3,1,1 -r 0
  • nprobe -i dnacluster:10@0 -g 1
  • nprobe -i dnacluster:10@1 -g 2
  • nprobe -i dnacluster:10@2 -g 3
  • n2disk -i dnacluster:10@3  ….
  • other_app -i dnacluster:10@4 …

In essence in pfdnacluster_master the -n parameter is a comma separated list of numbers, where:

  • If the number is 1 it means that the aggregation of  the ingress traffic is sent in zero-copy to this application. All the traffic, no balancing.
  • If the number is greater than 1, then the traffic is balanced across the consumer applications.

For mobile, GTP-encapsulated traffic, we have developed a more versatile application named DNALoadBalancer.

# ./DNALoadBalancer -h
Usage:
DNABalancer [-h][-d][-a][-q] -c <id> -i <device>
[-n <num app> | -o <devices>] [-f <path>]
[-l <path>] [-p <path>] [-t <level>]
[-g <core_id>]

-h             | Help
-c <id>        | Cluster id
-i <devices>   | Capture device names (comma-separated list) [Default: dna0]
-n <num app>   | Max number of slave applications (max 32) [Default: 1]
-o <devices>   | Egress device names (comma-separated list) for balancing packets across interfaces
-m <dissector> | Dissector to enable:
               | 0 - n-tuple [Default]
               | 1 - GTP+RADIUS 
               | 2 - GRE 
-q             | Drop non GTP traffic (valid for GTP dissector only)
-r             | Reserve first application for signaling only
-s <type>      | n-Tuple type used by the hash algorithm:
               | 0 - <Src IP, Dst IP> [Default]
               | 1 - <Src IP, Dst IP, Src Port, Dst Port, Proto, VLAN>
               | 2 - <Src IP, Dst IP, Src Port, Dst Port, Proto, VLAN> with TCP, <Src IP, Dst IP> otherwise
-u <mode>      | Behaviour with tunnels:
               | 0 - Hash on tunnel content [Default]
               | 1 - Hash on tunnel ID
               | 2 - Hash on outer headers
-d             | Run as a daemon
-l <path>      | Log file path
-p <path>      | PID file path [Default: /tmp/dna_balancer.pid]
-t <level>     | Trace level (0..6) [Default: 0]
-g <core_id>   | Bind to a core
-a             | Active packet wait

Example:
DNABalancer -i 'dna0,dna1' -c 5 -n 4

As shown in the application help, it implements a versatile dissector (-m) for tunnelled traffic (GTP and GRE), has the ability to drop non-encapsulated traffic (-q) so we can ignore if necessary, non-interesting messages, and decide how to handle tunnelled balancing (-u).

In essence as long as you have enough cores on your system to allocate to the balancer, you can avoid purchasing costly yet not-so-versatile traffic balancers. As we release the source code of apps such as the pfdnacluster_master, you can change your traffic balancing policies the way you want/like without relying on any hardware traffic balancer manufacturer. Nice and cheap, isn’t it?

Introducing nProbe Splunk App for (Free) Network and Application Monitoring

$
0
0

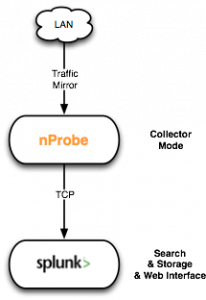
Splunk is a popular realtime data capture, aggregation, and data visualisation system. Designed initially for handling application logs, in its current version is available  with a free enterprise license can index up to 500 megabytes of data per day. We have decided to use Splunk to capture and index in realtime flows generated by nProbe, and in particular those that contain non-numerical information, such as HTTP URLs for instance. The versatile of splunk is such that it can be easily customised with a few mouse clicks, so that new reports, views and triggers can be created in second. Hence we have create a free nProbe Splunk Application (released under GPLv3 and platform independent so you can run it for instance on Linux, Windows or MAC OSX) that you can use as graphical monitoring console for nProbe. All details are explained in the nProbe Splunk QuickStart Guide, but the impatient can read this quick short guide:

  • You need nProbe 6.16 or newer, that you can use as flow probe and/or collector. nProbe will send splunk flow information (in essence nProbe is a flow producer and splunk a flow collector) formatted in JSON. For instance you can start nProbe as follows (note the –tcp <host>:<port> that specified the Splunk host collection port implemented by the nProbe-Splunk App)
    nprobe -T “%IPV4_SRC_ADDR %L4_SRC_PORT %IPV4_DST_ADDR %L4_DST_PORT %PROTOCOL %IN_BYTES %OUT_BYTES %FIRST_SWITCHED %LAST_SWITCHED %HTTP_SITE %HTTP_RET_CODE %IN_PKTS %OUT_PKTS %IP_PROTOCOL_VERSION %APPLICATION_ID %L7_PROTO_NAME %ICMP_TYPE” –tcp “127.0.0.1:3333” -b 2 -i eth0 –json-labels
  • Splunk ArchitectureVia the nProbe Splunk app we have developed, Splunk will start receiving flows and index them in realtime.
  • The nProbe Splunk application will then start populating the defined reports as depicted in the image gallery below.

Click to view slideshow.


The reports we created, in addition to “classic” host/traffic information (top hosts, top application protocols [via nDPI] etc.), allow for instance to depict the top HTTP sites accessed, the mime-types or return code. As manipulating text is one of the things Splunk does well (usually flow-collectors are good with IPs and ports but not with text), you don’t have to be afraid to use the application for creating custom reports based on text. We have implemented HTML reports, but nothing prevents you from creating similar reports for VoIP, email or mobile traffic (e.g. top IMSI or APN). nProbe (via the new –tcp command line flag and its revamped JSON engine) can export all plugin information to splunk, and you can create your own reports in a few clicks using the application we developed.

As we are giving away for free the Splunk application, we hope that users will contribute to it and send us patches so that we can make them available to the whole community. Many thanks to our colleague Filippo for leading this project.

Enjoy!

Monitoring Mobile Traffic (3G/LTE) with nProbe and ntopng #sharkfest14

$
0
0

IMG_2165

At Sharkfest 2014 we have made a presentation/tutorial about mobile traffic monitoring using the ntop tools. Those who have not attended the conference can still have a chance to look at the presentation.


Introducing nProbe v7

$
0
0

After more than three years of work, we are announcing the release of nProbe v7. This is a major evolution of v6 that many of you used in the bast few years. In essence we have worked a lot for improving the application performance, supporting new protocols (including mobile 3G/LTE network monitoring), adding new information elements and moving towards an accurate probe. nProbe still exports the data in NetFlow/IPFIX but we have opened it to new ways of handling monitoring data (e.g. using Splunk and ElasticSearch). This because today we cannot monitor traffic up to layer 4 as many probes still do. People want to see what happens at application level, know what processes are doing what (in terms of network traffic, CPU, I/O) and with whom are speaking to. For years network monitoring has been perceived as a special problem with special solutions. We do not think this statement is still true. nProbe is a data source, that can emit data using legacy formats (e.g. IPFIX/NetFlow) or on more “modern” formats as previously discussed on this blog. ntopng can be used as web console for nProbe so that you can have a complete probe/collector solution, even though you can still use your favourite flow collector.

The main changes are listed below:

  • Various fixes for improving probe reliability
  • Support for multi-tag VLAN packets
  • Added Layer-7 traffic categorisation (via nDPI)
  • Flow export in JSON format for integration with products such as ElasticSearch and Splunk
  • Implemented de-duplication of IPv4 packets
  • Redesigned hash implementation to improve overall performance
  • Added support for PF_RING clusters and non-commodity adapters
  • Improved flow and packet sampling
  • Support of encapsulations such as GTP (v0, v1, v2), PPP (including multilink), ERF (Endace), PPPoE, ESP, GRE, Mobile IP
  • Added SCTP support
  • Enhanced CPU binding and core affinity
  • Implemented smart UDP fragment handling for reducing fragment processing overhead
  • Added ability to specify a black list of IP networks for discarding specific flows
  • Added ability to account layer-2 traffic into flows
  • Implemented ability to dump on pcap files suspicious packets (e.g. those that cannot be decoded properly)
  • Added ability to handle hardware timestamped packets such as those generated by specialised hardware NICs and IXIA devices
  • Replaced FastBit support with MySQL/InfiniDB for flow dump on a database
  • Improved flow generation capability when using pcap files instead of live capture
  • Added support of microcloud for creating a distributed probe knowledge base
  • Improved application/network latency computation that is now also computed in the middle of a TCP connection and not just at the beginning
  • Major improvements in various plugins such as HTTP, VoIP (SIP, RTP) and DNS
  • Added plugins for decoding GTP-C traffic (V0, v1, v2)
  • Added DHCP, FTP, POP3, IMAP, Oracle, MySQL, whois plugins
  • Added process plugin for monitoring system activities and combining them with network traffic
  • Implemented enhanced VoIP plugins that feature voice quality (pseudo-MOS/R-Factor) measurement
  • Support of Windows x64 (Win32 is now an obsoleted platform).

In the coming days we will introduce in detail some major features of this new release such as the process plugin (that inspects in detail application traffic) and VoIP analysis plugins that report you about voice quality.

nProbe is available in both binary (for selected platforms such as Windows x64 and CentOS/Ubuntu server) and source format. Plugins are available only in binary format and we’ll evaluate case-by-case the release of their source (e.g. research institutions).


Enjoy!

Combining System and Network Visibility using nProbe and Sysdig

$
0
0

Introduction


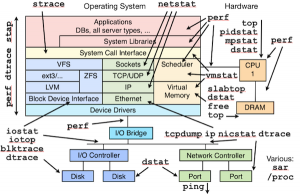
When in 1998 we have started the development of the original ntop, there were many Unix tools for monitoring network traffic: ping, tcpdump, netstat, and many others. Nevertheless we have decided to develop ntop, because there was no tool able to show on a simple way what was happening on our network. Early this year we have started the development of some experimental PF_RING kernel module extensions able to give ntop applications visibility of process activities, this in order to bind network traffic with a process name. We have lived once more the early ntop days when last May our friends at Draios have introduced sysdig and made all this mess below history.

System Monitoring Tools

We have therefore put our experimental code in the trash and started hacking on top of sysdig.


Our Vision: Combine System with Network Information


The idea is very simple: we want to associate a process name with every network activity, and monitor the process resources  (CPU, memory and I/O) used to carry on such activity. With flow-based paradigm what we see is depicted below.

Pre-sysdig

In essence we see hosts, ports, protocols and flows, but we lack visibility on the process that did all that. This has been the driving force to combine system with network monitoring, so that when system administrators see an increase in HTTP application response time, they can:

  1. Get the list of all the processes that were running when such HTTP request was served.
  2. Know what system resources were used by the process that served such request while serving such request (and not since process startup).

In essence we want empower system administrators and let them know what is happening on their system, also from the security point of view. You can finally know what is the name of the process that sent the packet-of-death so that you can find it on the system and neutralise it. As we’ve been playing with network flows for more than a decade, we believe that we can apply the same principle to system processes, by modelling them similar to flows.

In order to achieve all this we have extended our flow probe nProbe with sysdig, by developing a new process monitoring plugin that implements new information elements that can be exported via NetFlow/IPFIX or JSON to ntopng and other applications. The big challenge has been to monitor the system while keeping the CPU utilisation low, as busy systems can produce a lot of system events; for this reason we have implemented event filters so that nProbe analyses only those events that are necessary to carry on the job, while discarding the others inside the kernel (i.e. they are not sent by sysdig to the user-space app at all). The new information elements include:

[NFv9 57640][IPFIX 35632.168] %SRC_PROC_PID                Src process PID
[NFv9 57641][IPFIX 35632.169] %SRC_PROC_NAME                    Src process name
[NFv9 57844][IPFIX 35632.372] %SRC_PROC_USER_NAME               Src process user name
[NFv9 57845][IPFIX 35632.373] %SRC_FATHER_PROC_PID              Src father process PID
[NFv9 57846][IPFIX 35632.374] %SRC_FATHER_PROC_NAME             Src father process name
[NFv9 57855][IPFIX 35632.383] %SRC_PROC_ACTUAL_MEMORY           Src process actual memory (bytes)
[NFv9 57856][IPFIX 35632.384] %SRC_PROC_PEAK_MEMORY             Src process peak memory (bytes)
[NFv9 57857][IPFIX 35632.385] %SRC_PROC_AVERAGE_CPU_LOAD        Src process avg load (% * 100)
[NFv9 57858][IPFIX 35632.386] %SRC_PROC_NUM_PAGE_FAULTS         Src process num pagefaults
[NFv9 57865][IPFIX 35632.393] %SRC_PROC_PCTG_IOWAIT             Src process iowait time % (% * 100)
[NFv9 57847][IPFIX 35632.375] %DST_PROC_PID                     Dst process PID
[NFv9 57848][IPFIX 35632.376] %DST_PROC_NAME                    Dst process name
[NFv9 57849][IPFIX 35632.377] %DST_PROC_USER_NAME               Dst process user name
[NFv9 57850][IPFIX 35632.378] %DST_FATHER_PROC_PID              Dst father process PID
[NFv9 57851][IPFIX 35632.379] %DST_FATHER_PROC_NAME             Dst father process name
[NFv9 57859][IPFIX 35632.387] %DST_PROC_ACTUAL_MEMORY           Dst process actual memory (bytes)
[NFv9 57860][IPFIX 35632.388] %DST_PROC_PEAK_MEMORY             Dst process peak memory (bytes)
[NFv9 57861][IPFIX 35632.389] %DST_PROC_AVERAGE_CPU_LOAD        Dst process avg load (% * 100)
[NFv9 57862][IPFIX 35632.390] %DST_PROC_NUM_PAGE_FAULTS         Dst process num pagefaults
[NFv9 57866][IPFIX 35632.394] %DST_PROC_PCTG_IOWAIT             Src process iowait time % (% * 100)

Thanks to this new plugin it is possible to know for each flow peer the process name/PID/father-PID/memory/IO/CPU used during the duration of the flow. As this information is exported on a standard format, all flow collectors on the market can use nProbe generated flow to enhance their monitoring experience. However we have decided to do something special in ntopng to make system information a first class citizen.

Running the System


You can find binary, ready-to-use packages at

that you can install via apt-get or yum depending on your platform: you need to install nprobe, pf_ring and ntopng. Also remember that the sysdig kernel module must be loaded prior to run the system (i.e. do “sudo modprobe sysdig_probe”).

In order to activate system+network monitoring, you can start nProbe v7 (flow probe) as follows

nprobe -T “%IPV4_SRC_ADDR %L4_SRC_PORT  %IPV4_DST_ADDR %L4_DST_PORT %IN_PKTS %IN_BYTES
%FIRST_SWITCHED %LAST_SWITCHED” %TCP_FLAGS %PROTOCOL @PROCESS@ %L7_PROTO --zmq “tcp://*:1234”
-i any --dont-drop-privileges -t 5 -b 2

then start ntopng (flow collector – you need to use 1.2.1 or the code currently in SVN) as follows (note that you can merge process information coming from various hosts onto the same ntopng interface so that it is automatically merged):

ntopng -i tcp://nprobe1.ntop.org:1234,tcp://nprobe2.ntop.org:1234 …

At this point ntopng is ready to combine system with network activities as shown below. Note that as nProbe has visibility restricted to local system events, you need to install it on each system on which you want to have system visibility.

Click to view slideshow.

Visualising Flows and Processes on ElasticSearch/Kibana


If all this is not what you are looking for, we have also integrated ntopng with ElasticSearch, a flexible big-data system, that allows you to store flows on a distributed and replicated environment for long term historical analysis (just start ntopng adding -F es).

Click to view slideshow.

We are also developing custom dashboards built on top of Kibana, for letting you create in a few minutes your custom flow/process monitoring dashboard. Above you can find some sample dashboards.

What’s Next


At the moment we’re monitoring just processes that make network activities but the plan is to monitor all processes, regardless of them sending any byte on the wire. Furthermore we want to extend the ntopng process visibility with new reports to make processes/memory/users first class citizens.

Final Remarks


nProbe and the process plugin, as well ntopng are immediately available from http://packages.ntop.org packaged for CentOS and Ubuntu platforms. It is now time to really see what is really happening on your system going beyond the classic network flow monitoring paradigm.

If you want to learn more about this project, you’re welcome to attend the ntopng tutorial at the upcoming LISA 2014 conference that will take place next month in Seattle, WA.

Yes, There’s Life After NetFlow

$
0
0

At ntop we’ve been playing with NetFlow/IPFIX since more than 10 years and been part of its standardisation. While we acknowledge that concept of flow (a set of packets with common properties such as the same IP/port/protocol/VLAN) is still modern, the NetFlow format is now becoming legacy as we have already discussed some time ago. Modern data crunchers such as those belonging to the big data movement or emerging data storage systems (e.g. Solr or ELK) are  based on the concept that information has to be defined on an open format (usually JSON) and that it has to be stored on systems that are agnostic to the data nature. For years (but for many companies it is still like that today) network administrators considered NetFlow an exception, as it needed to be processed with special tools (often called NetFlow collectors) and that often have an extra price tag, simply because the protocol was “so special”. If you read some books just released, you will realise that even in late 2015 this message is still pushed out by NetFlow vendors. Unfortunately.

At ntop, we believe that this statement is not true, and that NetFlow is not special at all: it is just an old legacy format that makes difficult for people to use flow-centric information that instead is still very modern (with some limitations that we’ll discuss in a future post). That’s all. One of the problems of NetFlow/IPFIX is the protocol that lacks many modern features, and that pushes apps to deal with this binary format. People realised that and started to create conversion tools from NetFlow-to-something so that we can finally use flow information without the legacy of their format. For this reason we have started to add in nProbe new export formats that preserve the flow-information while exporting data in open formats. Currently nProbe can natively export flow-information in:

  • NetFlow v5/v9/IPFIX for legacy apps and collectors.
  • Log-based textual flow information for people who want to pipe/sed/grep on text.
  • Flow-to-MySQL/MariaDB for filling up a DB with flow information, or with periodic batch database import by processing the textual logs using DB-import utilities.
  • Flow-to-ElasticSearch export so that nProbe can create indexes and import data into ELK without the need of external log-processing tools such as Logstash that make the process more complicated and with extra latency.
  • Flow-to-KAFKA exporting data into the Apache Kafka broker that is used also in networking.
  • Flow-to-ZeroMQ export for simultaneously sending flow information in JSON format to non-legacy consumers such as ntopng.

Having a native flow export into the probe, not only removes the need to have conversion tools involved, but it speeds up the operations. It also avoids (at the source) to deal with issues such as various flow formats and dialects (for instance nProbe supports various extensions such as Cisco ASA or PaloAlto) that will transform your NetFlow experience into a nightmare.

Towards 100-Gbit Flow-Based Network Monitoring

$
0
0

Last week we have previewed at FlowCon 2016 conference our new 100 Gbit probe called nProbe cento (cento is 100 in Italian). You can find our presentation slides here.

We believe that it is important to combine flow monitoring with security and packet to disk. This in an integrated manner, and not by using different un-correlated applications. Cento is the next generation probe able to generate flows at 100 Gbit line rate using an x86 PC and a 100 Gbit NIC on top of PF_RING ZC, while being able to selectively send packets to IDSs or packet-to-disk applications. In essence what we want to achieve with cento is: flows for everything, packets for something.

While we plan to release Cento sometime this spring, for those interested in testing it, you need to go to packages.ntop.org and install the development version of the nProbe package that includes a new binary named cento.

Stay tuned!

How to Build a 100$/€ “Augmented” NetFlow/IPFIX Probe

$
0
0

One of main problems of flow-based devices is their high cost or poor monitoring capabilities (nothing beyond IPv4 packets and bytes). At ntop we believe that network visibility is much more than this, as people in 2016 want application performance, deep packet inspection, export to big data system and much more. We’re experimenting with low-cost hardware devices since a long time but we finding a powerful yet cheap device with  embedded port mirror capability isn’t that simple (or cheap). Finally we have found a solution for families and small business who want to see what’s happening on their network without spending much. The Ubiquity EdgeRouter X (ntop has no relationship with Ubiquity Networks, we’re just happy users) is a good device for our purposes, but having it 128 MB or free ram, we cannot run ntopng (at least the current version) on it, but nProbe can work on it.

As depicted below, the nice thing of this device is the fact that it comes with 5 ethernet ports, that can work independently or grouped. This means you have plenty of ports for connecting your Internet connection and your LAN to it. The trick is to use this device transparently so that you do not have to mess up with IP addresses, DHCP or gateways. To do this you can configure the device to group the ports via the bridge br0.


Screen Shot 2016-03-05 at 10.59.17

The difference between it and switch0 is that on the former case packets are bridged by Linux running on the device, on the latter is the hardware switch that does it. Although the second option is more performant,  the first one is the one we are looking for packets hit Linux and thus nProbe can see them, whereas on the other case we can see just broadcast/multicast packets.

EdgeRouterX

In essence you can use the first port for exporting flows, and group the other ports as an ethernet switch where you attach your LAN/Access Point and the Internet connection/xDSL Router. Then you need to do this:

  • Download the nProbe package for EdgeRouter X to your PC.
  • scp <nprobe package you downloaded>.deb ubnt@<router IP> (the default password is ubnt)
  • ssh ubnt@<router IP>
  • sudo su
  • dpkg -i <nprobe package you downloaded>.deb
ssh ubnt@192.168.1.8
Welcome to EdgeOS

By logging in, accessing, or using the Ubiquiti product, you
acknowledge that you have read and understood the Ubiquiti
License Agreement (available in the Web UI at, by default,
http://192.168.1.1) and agree to be bound by its terms.

ubnt@192.168.1.8's password: 
Linux ubnt 3.10.14-UBNT #1 SMP Fri Jan 29 20:03:40 PST 2016 mips
Welcome to EdgeOS
ubnt@ubnt:~$ sudo su
root@ubnt:/home/ubnt# dpkg -i nprobe_7.3.160305-4921_mipsel.deb 
(Reading database ... 33861 files and directories currently installed.)
Preparing to replace nprobe 7.3.160305-4921 (using nprobe_7.3.160305-4921_mipsel.deb) ...
Unpacking replacement nprobe ...
/sbin/ldconfig: /usr/local/lib/libhiredis.so.0.13 is not a symbolic link

/sbin/ldconfig: /usr/lib/libzmq.so.3 is not a symbolic link

Setting up nprobe (7.3.160305-4921) ...
Rebuilding ld cache...
/sbin/ldconfig: /usr/lib/libzmq.so.3 is not a symbolic link

Adding the nprobe startup script
Making the /etc/nprobe directory...
Making the /var/log/nprobe directory...
root@ubnt:/home/ubnt# nprobe --version

Welcome to nProbe v.7.3.160305 (r4921)

Copyright 2002-16 ntop.org

Build OS:      EdgeRouter X
SystemID:      E809B957499602D2
Edition:       nProbe Embedded
License:       6E0AB140A8B1596D1AA5DB7E4C80064D148871506412BF6396 [valid license]
License Type:  Permanent License 
Maintenance:   Until Sun Mar  5 12:57:44 2017 [362 days left]

nProbe is subject to the terms and conditions defined in
the LICENSE and EULA files that are part of this package.

nProbe also contains third party code:
Radix tree code - (C) The Regents of the University of Michigan
                      ("The Regents") and Merit Network, Inc.
sFlow collector - (C) InMon Inc.

Now what you need to do is to create a configuration file for nprobe and start it. Note that:

  • the EdgeRouter X is based on the mipsel architecture whereas other EdeRouter models are not, so make sure you pick the right nprobe version.
  • nProbe on EdgeRouter is the embedded edition (just like for Raspberry PI) that is the same as the Pro version on x64 but that is much cheap (you can buy a license on our shop unless you are an educational user that can get it for free as all our products). In total the hardware+software combination will cost ~100$/€.

As usual, you can instruct nProbe to send flows to ntopng for collection via ZMQ as follows.

ubiquity> # nprobe --zmq tcp://0.0.0.0:1234 -i br0 -n none

your PC>  # ntopng -i tcp://ubiquity:1234

Note that you can enable on nProbe all the standard information elements such as packets out-of-order/retransmissions, DPI, HTTP URL, DNS query dissection, VoIP traffic analysis…. The fact that this solution is so cheap does not mean that it is limited, as it includes the same features you can find on a more powerful machine; the only difference is the hardware platform that makes it suitable for home and small businesses and not for an enterprise.

Happy traffic analysis!

Advanced Flow Collection with ntopng and nProbe

$
0
0

In flow-based monitoring there are two main components: the probe (a.k.a. flow exporter) and the flow collector/analyser. Usually NetFlow/sFlow is a push mode paradigm as network devices have almost no memory/storage and thus they send out data as soon as possible towards a collector. This architecture is suboptimal as the probe is pushing the same data to all collectors (i.e. collector X cannot tell the probe that it is interested only to HTTP-based flows, but it has to collect everything and discard un-needed information) and also because in case a new collector has to be added, the probe has to be reconfigured (i.e. no dynamic attach/detach). Another issue is that data exchanged is in clear, meaning that anyone intercepting flows sent by the probe, can find out what happens in the monitored network; we are aware that you can setup a dedicated VLAN/VPN to avoid this but this practice adds complexity.

ntopng has reverted this paradigm using a poll-mode architecture.

PollMode

Via ZMQ ntopng dynamically subscribes to the probe, tells the probe what type of flow data it is interested in, and the probe sends ntopng only this information, without sending all flows to ntopng as probes do. This practice optimises network traffic and limits the CPU cycles to those really necessary to carry on to collect flows.

This architecture however is unable to operate in case of a NAT.

PushMode
In fact, in case you run the ntopng collector on a public IP (e.g. on a cheap VPS host) and nProbe on a private network, ntopng is unable to connect to the probe and thus flow collection won’t work.

In the latest development versions of ntopng and nProbe, we have introduced several enhancements to address these issues. In particular:

  • nProbe/ntopng can now operate both in pull/push mode.
  • Flow information is not compressed and (optionally) encrypted: your privacy is preserved even when sending traffic over the Internet.
  • ntopng now subscribes to nProbe for second-based throughput statistics, so that you will now see in ntopng realtime throughput statistics even if you configure the probe to aggregate flows to 1 min or more.

Let’s see how to use flow collection. Suppose that you run ntopng on host X and nProbe on host Y.

Poll Mode
host X> ntopng -i "tcp://Y:1234" --zmq-encrypt-pwd myencryptionkey
host Y> nprobe -n none --zmq "tcp://*:1234" --zmq-encrypt-pwd myencryptionkey
Push Mode
host X> ntopng -i "tcp://Y:1234" --zmq-collector-mode --zmq-encrypt-pwd myencryptionkey
host Y> nprobe -n none --zmq "tcp://*:1234" --zmq-probe-mode --zmq-encrypt-pwd myencryptionkey
Notes:
  • All the zmq options have a double dash “-“. Example –zmq .. –zmq-encrypt-pwd… etc.
  • The –zmq-encrypt-pwd is optional: if you set it data is encrypted with the specified symmetric key. In ntopng, in case you have configured multiple probes, the same encryption key is used for all probes (i.e. you cannot set a per-probe encryption key).
  • Flows are always sent in compressed format. Space savings can range from -30/-40% up to -90%.
  • ntopng now automatically subscribes to nProbe for 1 second traffic updates.

In ntopng you will now see an enhanced view of your probes, knowing not just traffic stats but also additional information such as remote probe IP (even if behind a NAT), the public IP from which flows are collected, and the interface speed being monitored by the probe.

nProbe Stats

In essence you can now see in realtime both your flows, traffic statistics and remote probe information. All using as little bandwidth as possible, protecting your flow information with encryption.

We believe that with these enhancements, we have created a very advanced flow-collection architecture, that addressed concerns of using the flow paradigm over the Internet and that gives users maximum flexibility now available with traditional probes/collectors.

Introducing nProbe 7.4

$
0
0

This to announce the release of nProbe 7.4. We have worked hard in this version to improve it in several way by better integrating it with ntopng, improving network performance metrics computation, ability to export data to big-data systems, make VoIP quality metrics more reliable. However the bigger innovation in this release is the probe scriptability using Lua (see the nProbe User’s Guide for all details).

You can now perform actions on flows (e.g. if you see a DNS query for host www.ntop.org then execute action X) and start moving nProbe into new lands where network visibility can be combined with actions performed when specific situations occur. On a smaller scale, similar to what Bro has done for years with its scripting language using the power of Lua and on top of NetFlow/IPFIX. We hope you will enjoy this feature that will enable you to execute on the probe side actions that you used to perform on the collector side much less efficiently.

Below you can find the complete nProbe changelog.

Enjoy nProbe!


nProbe 7.4 Changelog

Main New Features

  • Lua scriptability and support for plugins: DHCP, DNS, IMAP, RADIUS, SIP, SMTP, GTPv1, POP, FTP, HTTP
  • Ability to drop HTTP flows via Lua
  • Ability to push flow information into Lua (e.g., flow.protocol, flow.l7_proto)
  • ZMQ data encryption to safely exchange information with ntopng
  • ZMQ data compression to reduce the bandwith consumed when interacting with ntopng
  • ZMQ probe mode to seamlessly work behind firewalls / NATs
  • HTTP full requests/responses content dump
  • Ability to specify traffic capture direction (tx, rx, both)
  • Flows dump to syslog in JSON format
  • Flows export to Apache Kafka via the export plugin
  • Implemented SSDP and NETBIOS plugins
  • Implemented CAPWAP protocol support
  • MIPSEL builds

New Options

  • --add-engineid-to-logfile to append the NetFlow engineId to dump files
  • --bind-export-interface to bind export socket to the specified interface
  • --capture-direction to specify packet capture direction
  • --cli-http-port command line
  • --disable-startup-checks to prevent nProbe public ip detection
  • --host to capture packets from pcap interfaces rather than from a mirror/tap
  • --json-to-syslog to export flows to syslog in JSON format
  • --notify-plugin to notify users of a pluging activity immediately and not when the flow has matched
  • --online-license-check to check nProbe license online
  • --with-minimal-nprobe to build nProbe with a minimum set of dependencies
  • --zmq-encrypt-pwd to encrypt ZMQ data
  • --zmq-probe-mode to implement ZMQ probe mode
  • --http-dump-dir to dump HTTP logs
  • --http-content-dump-dir to dump full HTTP requests content
  • --http-content-dump-response to dump both HTTP requests and responses content with --http-content-dump-dir
  • --http-content-dump-dir-layout to specify layout to be used with --http-content-dump-dir
  • --http-exec-cmd to execute a command whenever an HTTP dump directory has been written
  • --minute-expire to force active flows to expire when a minute is past

Plugin Extensions

  • Extended the export template with %BITTORENT_HASH, %PACKET_HASH, %SSL_SERVER_NAM, %UPSTREAM_SESSION_ID, %DOWNSTREAM_SESSION_ID, %SRC_AS_MAP and %DST_AS_MAP
  • Extended the export template to include longitude and latitude (%SRC_IP_LONG, %SRC_IP_LAT, %DST_IP_LONG and %DST_IP_LAT)
  • Implemented SIP RTP support, handling of early export and support of OPTIONS messages
  • Extended GTPV1 plugin support to field GTPV1_RAT_TYPE
  • Extended GTPV2 plugin support to fields GTPV2_C2S_S5_S8_GTPC_IP and GTPV2_S2C_S5_S8_GTPC_IP, GTPV2_PDN_IP, GTPV2_END_USER_IMEI, GTPV2_C2S_S5_S8_GTPU_TEID, GTPV2_C2S_S5_S8_GTPU_IP, GTPV2_S2C_S5_S8_GTPU_TEID, GTPV2_S2C_S5_S8_GTPU_IP, GTPV2_C2S_S5_S8_SGW_GTPU_TEID, GTPV2_S2C_S5_S8_SGW_GTPU_TEID, GTPV2_C2S_S5_S8_SGW_GTPU_IP and GTPV2_S2C_S5_S8_SGW_GTPU_IP
  • GTPV2 plugin check to the export bucket when response isn’t the right type for a request and when a response has been done from the same peer as the request
  • Implemented GTPV2 0x4A message type management
  • Implemented Diameter support of fields DIAMETER_CLR_CANCEL_TYPE and DIAMETER_CLR_FLAGS and 3GPP type messages (317, 319, 320, 321, 322 and 323)
  • Extended the Diameter plugin in order to export “”Diameter Hop-by-Hop Identifier” information
  • Added DOT1Q_SRC_VLAN/DOT1Q_DST_VLAN for supporting Q-in-Q VLANs
  • HTTP plugin export of HTTP_X_FORWARDED_FOR and HTTP_VIA fields
  • Extended DNS plugin with multicast DNS

ZMQ

  • ZMQ event handling to send interface statistics to ntopng
  • ZMQ statistics in flow collector mode
  • Ability to use ZMQ zlib compression
  • Enhanced ZMQ statistics with bps/pps rates

Miscellaneous

  • Added black list support for netflow data when nprobe is in proxy mode (ipv4 – V5,V9,IPFIX)
  • Twitter heuristics to guess user activities
  • Implemented support for TCP fast retransmissions

Introducing nProbe Cento: a 1/10/40/100 Gbit NetFlow/IPFIX Probe, Traffic Classifier, and Packet Shunter

$
0
0

Traditionally ntop has focused on passive traffic analysis. However we have realized that the traffic monitoring world has changed and looking at network flows is no longer enough:

  • People want to enforce policies: if the network is hit by a security threat you need to stop it, without having to tweak with router ACLs or deploying yet another box to carry on this task.
  • Combine visibility with security: flow-based analysis has to be combined with traffic introspection, activities that tools like Bro, Suricata and Snort do. Unfortunately these applications are CPU-bound so, in order to boost their performance, there are two viable ways: reduce the packet-processing cost (this has already been done years ago); or reduce the ingress by not forwarding to these applications the traffic that it does not make sense to process (e.g.  YouTube packets or the payload of encrypted SSL packets).
  • 40 Gbit networks (or multi-10Gbit links) are common, if not mainstream, and 100 Gbit is becoming commodity, therefore we need to be able to accurately (i.e., no sampling) monitor traffic at these rates.
  • Effectively utilize all the CPU cores as multi-processor and multi-core architectures are becoming cheaper every day (today you can buy a 22 physical cores CPU or a 10 physical core CPU for less that 1000$).
  • Deep packet inspection is now pervasive and thus there is the need to augment the old “host 192.168.2.222 and port 80″ BPF syntax with Layer-7 Applications: “host 192.168.2.222 and l7proto HTTP”. In essence, if packets matter to you, application protocol is yet another dimension you want to explore.
  • Integrate packet capture, traffic aggregation, flow processing, and packet analysis into a single physical box, because rack space matters and because now we have the technology and experience to achieve this.

Seen all these challenges above, and considering that we have the hardware and the technology (PF_RING ZC) to face such challenges, we have decided to rethink traffic monitoring and to design nProbe cento (cento in Italian means 100). Cento is not yet another flow-based probe. Cento is a compact application designed to a limited number of tasks very very fast, up to 100 Gbit. This because we want to compute flows out of the totality of ingress traffic.
So, yes, cento can operate at 100 Gbit unsampled and, optionally, do packet-to-disk recording with on-the-fly indexing that includes Layer-7 applications.

In addition, Cento supports packet shunting to:

  • Save precious disk space when doing packet-to-disk recording.
  • Significantly alleviate the load on IDS/IPS.

If you are wondering what we mean for packet shunting, imagine this. For protocols or flows you do not care much (e.g. a Netflix video or SSL), you may want to save the first packets of the flow (in SSL they contain the certificate exchange, in HTTP you can see the URL and the response) to preserve flow visibility but, at the same time, you would also like to avoid processing all the remaining flow packets. Why you would want to to fill up your disks with encrypted traffic? Why you would want to forward a Netflix video to your IDS/IPS?

Some Use Cases

nprobe_cento_full_duplex_tap_aggregator_and_flow_exporter

Passive Flow Probe (Packets to Flows) with (optional) Traffic Aggregation

nprobe_cento_100Gbps_probe_and_bridge

Inline Flow Probe With Traffic Enforcement Capabilities

nprobe_cento_100Gbps_probe_and_traffic_aggregator_

Passive Flow Probe with Zero Copy Packet-to-Disk with Shunting and on-the-fly Indexing up to the Layer-7

nprobe_cento_100Gbps_probe_and_traffic_balancerPassive Flow Probe With Zero Copy Balancing to IDS/IPS, including Shunting and Layer-7-based Filtering

Performance Evaluation

In order to evaluate the performance we present some results we obtained on a low-end Intel E3 server priced (server and network adapters) in the sub-1000$ range. In all the tests we have used Intel 10 Gbit NICs and the kernel bypass technology PF_RING ZC.

Flow Generation, Layer-7 Traffic Filtering and HTTP(S) Traffic Filtering

# ./cento-bridge -i zc:enp6s0f0,zc:enp6s0f1 -b doc/bridge.example -B doc/banned.example -v 4 -D 1

[bridge] default = forward
[bridge] banned-hosts = discard
[bridge] Skype = discard
[banned-hosts] 'facebook.com'
[banned-hosts] 'live.com'

Input: 128 IPs
20/Jun/2016 12:49:18 [NetworkInterface.cpp:969] [zc:enp6s0f0,zc:enp6s0f1] [14'340'967 pps/9.64 Gbps][128/128/0 act/exp/drop flows][33'648'924/1'895 RX/TX pkt drops][14'340'966 TX pps]
20/Jun/2016 12:49:18 [cento.cpp:1363] Actual stats: 14'340'967 pps/540'125 drops

Input: 8K IPs
20/Jun/2016 12:47:06 [NetworkInterface.cpp:969] [zc:enp6s0f0,zc:enp6s0f1] [14'178'764 pps/9.53 Gbps][8'192/8'192/0 act/exp/drop flows][37'367'255/0 RX/TX pkt drops][14'178'754 TX pps]
20/Jun/2016 12:47:06 [cento.cpp:1363] Actual stats: 14'178'764 pps/687'835 drops

Input: 500K IPs
20/Jun/2016 12:48:09 [NetworkInterface.cpp:969] [zc:enp6s0f0,zc:enp6s0f1] [10'091'554 pps/6.78 Gbps][500'000/4'288/0 act/exp/drop flows][58'217'698/0 RX/TX pkt drops][10'090'447 TX pps]
20/Jun/2016 12:48:09 [cento.cpp:1363] Actual stats: 10'091'554 pps/4'756'488 drops


Flow generation, on-the-fly Layer-7 Traffic Indexing and Packet-to-Disk Recording

# cento-ids -i eno1 --aggregated-egress-queue --egress-conf doc/egress.example --dpi-level 2 -v 4

# n2disk -i zc:10@0 -o /storage --index --timeline-dir /storage --index-version 2

As the traffic is indexed with both flow index and DPI, you can extract traffic based on DPI as shown below.

# npcapprintindex -i /storage/1.pcap.idx
10 flows found
0) vlan: 0, vlan_qinq: 0, ipv4, proto: 6, 192.168.2.143:49276 -> 192.168.2.222:22, l7proto: SSH/SSH
1) vlan: 0, vlan_qinq: 0, ipv4, proto: 17, 192.168.2.136:3242 -> 239.255.255.250:1900, l7proto: UPnP/UPnP
2) vlan: 0, vlan_qinq: 0, ipv4, proto: 17, 192.168.2.143:17500 -> 255.255.255.255:17500, l7proto: Dropbox/Dropbox
3) vlan: 0, vlan_qinq: 0, ipv4, proto: 17, 192.168.2.143:17500 -> 192.168.2.255:17500, l7proto: Dropbox/Dropbox
4) vlan: 0, vlan_qinq: 0, ipv4, proto: 6, 192.168.2.143:50253 -> 192.168.2.222:22, l7proto: SSH/SSH
5) vlan: 0, vlan_qinq: 0, ipv4, proto: 6, 192.168.2.143:49821 -> 192.168.2.222:22, l7proto: SSH/SSH
6) vlan: 0, vlan_qinq: 0, ipv4, proto: 17, 192.168.2.222:55020 -> 131.114.18.19:53, l7proto: DNS/DNS
7) vlan: 0, vlan_qinq: 0, ipv4, proto: 6, 192.168.2.222:51584 -> 52.30.119.198:80, l7proto: HTTP/HTTP
8) vlan: 0, vlan_qinq: 0, ipv4, proto: 17, 192.168.2.222:46729 -> 131.114.18.19:53, l7proto: DNS/Google

# npcapextract -t /storage/ -b "2016-06-20 17:00:00" -e "2016-06-20 17:15:00" -o /tmp/output.pcap -f "host 192.168.2.222 and l7proto HTTP"
20/Jun/2016 17:17:14 [npcapextract.c:1822] Begin time: 2016-06-20 17:00:00, End time 2016-06-20 17:15:00
20/Jun/2016 17:17:14 [npcapextract.c:1865] 850 packets (845094 bytes) matched the filter in 0.019 sec.
20/Jun/2016 17:17:14 [npcapextract.c:1877] Dumped into 1 different output files.
20/Jun/2016 17:17:14 [npcapextract.c:1899] Total processing time: 0.019 sec.

# tcpdump -nr /tmp/output.pcap | head
reading from file /tmp/output.pcap, link-type EN10MB (Ethernet)
17:12:38.895425 IP 192.168.2.222.51584 > 52.30.119.198.80: Flags [S], seq 891001947, win 29200, options [mss 1460,sackOK,TS val 4205898 ecr 0,nop,wscale 7], length 0
17:12:38.947537 IP 52.30.119.198.80 > 192.168.2.222.51584: Flags [S.], seq 1298651289, ack 891001948, win 17898, options [mss 8961,sackOK,TS val 19396500 ecr 4205898,nop,wscale 8], length 0
17:12:38.947556 IP 192.168.2.222.51584 > 52.30.119.198.80: Flags [.], ack 1, win 229, options [nop,nop,TS val 4205911 ecr 19396500], length 0
17:12:38.947591 IP 192.168.2.222.51584 > 52.30.119.198.80: Flags [P.], seq 1:82, ack 1, win 229, options [nop,nop,TS val 4205911 ecr 19396500], length 81: HTTP: GET / HTTP/1.1
17:12:39.053921 IP 52.30.119.198.80 > 192.168.2.222.51584: Flags [.], ack 82, win 70, options [nop,nop,TS val 19396516 ecr 4205911], length 0
17:12:39.059192 IP 52.30.119.198.80 > 192.168.2.222.51584: Flags [P.], seq 1:1439, ack 82, win 70, options [nop,nop,TS val 19396517 ecr 4205911], length 1438: HTTP: HTTP/1.1 200 OK
17:12:39.059199 IP 192.168.2.222.51584 > 52.30.119.198.80: Flags [.], ack 1439, win 251, options [nop,nop,TS val 4205939 ecr 19396517], length 0
17:12:39.059961 IP 52.30.119.198.80 > 192.168.2.222.51584: Flags [P.], seq 1439:2877, ack 82, win 70, options [nop,nop,TS val 19396517 ecr 4205911], length 1438: HTTP
17:12:39.059966 IP 192.168.2.222.51584 > 52.30.119.198.80: Flags [.], ack 2877, win 274, options [nop,nop,TS val 4205939 ecr 19396517], length 0
17:12:39.112307 IP 52.30.119.198.80 > 192.168.2.222.51584: Flags [.], seq 10997:12445, ack 82, win 70, options [nop,nop,TS val 19396541 ecr 4205939], length 1448: HTTP

You can read more about cento performance and use cases on this blog post or on the Cento User Guide. As a rule of thumb, keep in mind that cento can process 10 Gbit (14.88 Mpps) per core, so with a 4-core CPU as the Intel E3, you can monitor a 40 Gbit link.

Cento is not designed to be a sophisticated flow probe/collector: nProbe is already good at it and cento will not replace it. The idea is that if you need traffic visibility at line rate, with policy enforcement and packet-to-disk recording, then Cento is what you need. If instead you are looking for a sophisticated flow-based probe/collector able to dissect protocols such as VoIP, GTP and HTTP, then nProbe is the tool of choice.

For more information about availability, performance, and the full list of features, we invite you to visit the Cento web page. Awaiting your comments and feedback.

Flow-based Monitoring: nProbe Cento vs Standard/Pro

$
0
0

Since the introduction of nProbe Cento, we receive periodically emails of users wondering what are the differences between these two applications. This post is to clarify the differences, and better position them.
The nProbe family is a set of flow-oriented applications, meaning that each packet is not handled individually but as part of a flow (e.g. a TCP connection or a UDP communication such as a VoIP call). This task is significantly more expensive than handling packets individually because we need both to keep the flow state and process packets in order in addition to other restrictions (e.g. make sure all packets of the same flow are sent to the same processing core). Traditionally ntop has its roots in the network monitoring world, where people want to passively (i.e. without modifying the network traffic being watched) monitor their traffic in order to find out things like top talkers or troubleshoot problems. However in the past couple of years we have received many requests of users willing to do more than that (e.g. selectively drop traffic of specific applications via DPI) in a flow-oriented fashion. The advent of 40 and 100 Gbit ethernet, has pushed us to redesign nProbe and create an addition to the nProbe family targeting selected users who need to both monitor and manipulate traffic in a flow-oriented fashion. This is how nProbe Cento was born.

Below you can find some use-cases where we try to position all applications

Family Standard Pro Cento
Max Processing Speed 1 Gbit 10 Gbit 40/100 Gbit
Packet Processing Mode Passive Passive and Inline
Operating Systems Linux and Windows Linux
PF_RING (ZC) Integration No Yes
Platforms ARM, MIPS, x64 x64
DPI Traffic Inspection Yes (nDPI)
DNS/HTTP Traffic Dissection No Full (with DNS/HTTP plugins) Limited to core attributes
Flow-Latency Measurements Yes
Flow Collection Yes (both sFlow and NetFlow) No
Policy-based Interface Bridging No Yes
Plugin Extensibility No Yes No
Packet-to-Disk Integration No Yes (n2disk)
IDS/IPS Integration No Yes (with optional packet shunting)
Flow-based Interface Egress No Yes
Flow-based Packet Policy No Yes
Text/JSON/NetFlow v5/v9/IPFIX Export Yes
Kafka Integration No Yes

One of the most popular questions we receive is whether plugin support will be supported in Cento. Currently we have no plans for that as they would introduce significant processing overhead that will prevent cento from running at 100 Gbit (this is support on adequate hardware platforms where you have at least 12 cores for 100 Gbit line rate processing). However we might consider adding support for additional protocols fields (e.e. Cento dissects DNS/HTTP core attributes such as DNS query and HTTP URL) based on user’s feedback.

In summary, if you need to do only passive traffic monitoring at no more than 10 Gbit, then nProbe Standard/Pro is what you are looking for. Instead if you need to do both flow-based traffic inspection and inline traffic management (e.g. selectively drop Skype or NetFlix traffic) or add traffic metadata (i.e. add application protocol and flow-identifier) to packets that are recorded on disk, then Cento is the application to use.

ntop and Kentik bring nProbe to the Cloud

$
0
0

Traditionally nProbe is used as a host-based network monitoring probe able to produce “augmented” flow records including performance monitoring, security and visibility information.

We have a common vision with Kentik of how network instrumentation needs to evolve beyond “just” bytes and packets-based NetFlow, and of how that can enable users to understand network performance and security challenges.

This year, we entered a partnership with Kentik to leverage nProbe to export rich network metrics to the Kentik Detect big data network analytics cloud platform, and we’re proud to announce the first product based on this collaboration.

Today Kentik has introduced a cloud-based product named NPM (Network Performance Monitoring)  that uses their network-savvy big data-based analytics and nProbe as a source of augmented flow to allow ops staff to detect and pinpoint network and application problems based on actual user performance (as observed by nProbe).

ntop is proud to see nProbe being used in partnership with Kentik to address new monitoring challenges of, and in, the cloud.

See You Next Week at the ntop Users Meeting

$
0
0

This is to renew the invitation to meet you next week at the ntop users meeting colocated with Sharkfest Europe. The event is free of charge but seats are limited. More information can be found here.

Hope too see you next week at the workshop!

Stream That Flow: How to Publish nProbe/Cento Flows in a Kafka Cluster

$
0
0

Apache Kafka can be used across an organization to collect data from multiple sources and make them available in standard format to multiple consumers, including Hadoop, Apache HBase, and Apache Solr. nProbe — and it’s ultra-high-speed sibling nProbe cento — integration with the Kafka messaging system makes them good candidates source of network data. The delivery of network data to a redundant, scalable, and fault-tolerant messaging system such as Kafka enables companies to protect their data even in-flight, that is, when the consolidation in a database has still to occur.

An impatient reader who is eager to use Cento for delivering flows to a Kafka cluster having a broker at address 127.0.0.1:9092 on a topic named “topicFlow can use the following command

ntopPC:~/code/cento$ ./cento -i eth0 --kafka “127.0.0.1:9092;topicFlows"

Readers who are interested in learning more about Cento and Kafka should continue reading this article that starts by describing Cento-Kafka publishing mechanisms and then moves to a real configuration example. Finally, in the appendix, it describes how to setup Kafka both in a single- and multi-broker fashion.

Cento will be used in the remainder of this article to carry on the discussion. Examples and configurations given work, mutatis mutandis, also for nProbe.

Publishing nProbe Cento Flows to Kafka

Cento publish flow “messages” into a Kafka cluster by sending them to one or more Kafka brokers responsible for a given topic. Both the topic and the list of Kafka brokers are submitted using a command line option. Initially, Cento tries to contact one or more user-specified brokers to retrieve Kafka cluster metadata. Metadata include, among other things, the full list of brokers available in the cluster that are responsible for a given topic, and the available topic partitions. Cento will use the retrieved full list of brokers to push flow “messages” in a round robin fashion to the various partitions.

Cento also features optional message compression and message acknowledgement policy specification. Acknowledgment policies make it possible to totally avoid waiting for acknowledgements, to wait only for the Kafka leader acknowledgement, or to wait for an acknowledgment from every replica.

Setting Up Cento

Let’s say Cento has to monitor interface eth1 and has to export generated flows to Kafka topic “topicFlows”. The following command will do the magic

ntopPC:~/code/cento$ ./cento -i eth0 --kafka “127.0.0.1:9092,127.0.0.1:9093,127.0.0.1:9094;topicFlows"

The command above assumes flows have to be exported on topic topicFlows and that there are three brokers listening on localhost, on ports 9092, 9093 and 9094 respectively. These Kafka brokers are shown also in the picture below together with the running Cento instance

06-kafka-three-brokers-with-cento

Three Kafka Brokers (top and bottom left). Cento exporting to the brokers (bottom right).

Consuming Cento Flows

For the sake of example, the command-line script kafka-console-consumer.sh available in the bin/ folder of the Kafka sources is used to read messages from a Kafka topic (see the appendix for instructions on how to get it). In order to consume flows in the topicFlows we can use the command line-script as follows

ntopPC:~/kafka/kafka_2.11-0.10.1.0$ bin/kafka-console-consumer.sh --bootstrap-server localhost:9092 --topic topicFlows --from-beginning

Below is an image that shows flows that are being consumed from the Kafka cluster.

07-kafka-three-brokers-with-cento-consume-flows

Three Kafka Brokers (top and bottom left). Cento exporting to the brokers (bottom right). The command line consumer (middle right)

Note that flows can be consumed by any custom application that can interact with Kafka.

Cento and Kafka Topics

Cento takes as input a topic, that is, a string representing the generated stream of data inside Kafka. Topics can be partitioned and replicated. With reference to the topic being used, Cento has the following behavior:

  • If the topic doesn’t exist in the Kafka cluster, then Cento creates it with a single partition and replication factor 1
  • If the topic exists in the Kafka cluster, then Cento uses the existing topic and will send flows to the whole set of partitions in round-robin.

So, if the user is OK with a single-partition topic can simply fire up Cento that will create it. If more complex topic configurations are needed, then the topic has to be created in advance using, for example, the helper script kafka-topics.sh. We refer the interested reader to the remainder of this section for a detailed discussion on the Kafka setup and its topics.


Appendix

Setting Up Kafka

Prerequisites

Getting Kafka

The latest version of Kafka can be downloaded from https://kafka.apache.org/downloads. Download the latest tar archive (kafka_2.11-0.10.1.0.tgz at the time of writing), extract it, and navigate into the decompressed folder.

ntopPC:wget http://apache.panu.it/kafka/0.10.1.0/kafka_2.11-0.10.1.0.tgz
ntopPC:~/kafka$ tar xfvz kafka_2.11-0.10.1.0.tgz
ntopPC:~/kafka$ cd kafka_2.11-0.10.1.0/
ntopPC:~/kafka/kafka_2.11-0.10.1.0$ ls
bin config libs LICENSE logs NOTICE site-docs

Starting Zookeeper

Kafka uses Zookeeper to store a great deal of status information that includes, but is not limited to, the topics managed by each broker. An healthy Zookeeper installation consists of at least three distributed nodes. In this example, we will just start a quick-and-dirty zookeeper on the same machine that will run Kafka. This represents a single point of failure and should be absolutely avoided in production environments.

To start the zookeeper we can simply use the one that is shipped with Kafka as follows

ntopPC:~/kafka/kafka_2.11-0.10.1.0$ ./bin/zookeeper-server-start.sh config/zookeeper.properties
[...]
[2016-10-23 12:50:02,402] INFO binding to port 0.0.0.0/0.0.0.0:2181 (org.apache.zookeeper.server.NIOServerCnxnFactory)

Starting a Kafka Broker

Now that Zookeeper is up and running it is possible to start a Kafka broker by using the default configuration found under config/server.properties. Upon startup, the broker will contact the Zookeeper instance to exchange and agree on some status variables.

ntopPC:~/kafka/kafka_2.11-0.10.1.0$ ./bin/kafka-server-start.sh config/server.properties
[...]
[2016-10-23 12:52:01,510] INFO [Kafka Server 0], started (kafka.server.KafkaServer)

Creating a Kafka test Topic

A simple test Kafka topic with just one partition an replication factor 1 can be created using the kafka-topics.sh helper script.

ntopPC:~/kafka/kafka_2.11-0.10.1.0$ bin/kafka-topics.sh --create --zookeeper localhost:2181 --replication-factor 1 --partitions 1 --topic test

Graphically, topic creation is show in the following image.

01-kafka-create-topic-test

The running kafka broker (top left); the running zookeeper (top right) and the command issued to create the test topic (bottom).

Producing Messages on a test Topic

A command-line producer available in the bin/ folder can be used to test and see if the Kafka deployment can receive messages. The script will send messages (one per line) unless Ctrl+C is pressed to exit. In the following example two “ntop test” messages are produced and sent to the broker listening on localhost port 9092.

ntopPC:~/kafka/kafka_2.11-0.10.1.0$ bin/kafka-console-producer.sh --broker-list localhost:9092 --topic test
ntop test 01
ntop test 02

Consuming messages on a test Topic

A command-line consumer available in the bin/ folder can be used to read messages from a Kafka topic. In the following snippet the script is used to consume the two “ntop test” messages produced above. The script will wait for new messages until Ctrl+C will be pressed to exit.

ntopPC:~/kafka/kafka_2.11-0.10.1.0$ bin/kafka-console-consumer.sh --bootstrap-server localhost:9092 --topic test --from-beginning
ntop test 01
ntop test 02

Following is an image that shows how to consume messages from the topic.

Top: the kafka broker (left) and the Zookeeper (right). Bottom: The command-line consumer

Top: the kafka broker (left) and the Zookeeper (right).
Bottom: The command-line consumer

Muti-Broker

A real Kafka cluster consist of multiple brokers. In the remainder of this section is is shown how to add two extra Kafka brokers to the cluster that is already running the broker started above. In order to add the two kafka brokers two configuration files must be created. They can be copied from the default configuration file found in config/server.properties.

ntopPC:~/kafka/kafka_2.11-0.10.1.0$ cp config/server.properties config/server-1.properties
ntopPC:~/kafka/kafka_2.11-0.10.1.0$ cp config/server.properties config/server-2.properties

The two files will carry configuration information for two different brokers:

  • server-1.properties configures a broker as follows: broker id 1; listen on localhost port 9092 and log in /tmp/kafka-logs-1
  • server-2.properties configures a broker as follows: broker id 2; listen on localhost port 9093 and log in /tmp/kafka-logs-2

The relevant part of the configuration files is the following.

ntopPC:~/kafka/kafka_2.11-0.10.1.0$ cat config/server-{1,2}.properties | egrep '(id|listeners|logs)'
# The id of the broker. This must be set to a unique integer for each broker.
broker.id=1
# listeners = security_protocol://host_name:port
# listeners = PLAINTEXT://your.host.name:9092
listeners=PLAINTEXT://:9093
# it uses the value for "listeners" if configured. Otherwise, it will use the value
#advertised.listeners=PLAINTEXT://your.host.name:9092
log.dirs=/tmp/kafka-logs-1
# every N messages (or both). This can be done globally and overridden on a per-topic basis.
# A size-based retention policy for logs. Segments are pruned from the log as long as the remaining
# The id of the broker. This must be set to a unique integer for each broker.
broker.id=2
# listeners = security_protocol://host_name:port
# listeners = PLAINTEXT://your.host.name:9092
listeners=PLAINTEXT://:9094
# it uses the value for "listeners" if configured. Otherwise, it will use the value
#advertised.listeners=PLAINTEXT://your.host.name:9092
log.dirs=/tmp/kafka-logs-2
# every N messages (or both). This can be done globally and overridden on a per-topic basis.
# A size-based retention policy for logs. Segments are pruned from the log as long as the remaining

The two additional brokers can be started normally. They will discover each other — and the already running broker — through the Zookeeper.

ntopPC:~/kafka/kafka_2.11-0.10.1.0$ bin/kafka-server-start.sh config/server-1.properties
ntopPC:~/kafka/kafka_2.11-0.10.1.0$ bin/kafka-server-start.sh config/server-2.properties

Creating a Partitioned Topic

A replicated test topic named “topicFlowsPartitioned” can be created using the kafka-topic.sh helper script. Once created, the status of the topic can be queried using the same helper.

ntopPC:~/kafka/kafka_2.11-0.10.1.0$ ./bin/kafka-topics.sh --create --zookeeper localhost:2181 --replication-factor 3 --partitions 3 --topic topicFlowsPartitioned
Created topic "topicFlowsPartitioned".
ntopPC:~/kafka/kafka_2.11-0.10.1.0$ bin/kafka-topics.sh --describe --zookeeper localhost:2181 --topic topicFlowsPartitioned
Topic:topicFlowsPartitioned PartitionCount:3 ReplicationFactor:3 Configs:
 Topic: topicFlowsPartitioned Partition: 0 Leader: 2 Replicas: 2,1,0 Isr: 2,1,0
 Topic: topicFlowsPartitioned Partition: 1 Leader: 0 Replicas: 0,2,1 Isr: 0,2,1
 Topic: topicFlowsPartitioned Partition: 2 Leader: 1 Replicas: 1,0,2 Isr: 1,0,2

The creation of the partitioned topic is also shown in the image below

04-kafka-three-brokers

The three Kafka brokers (top and bottom left) and the creation of a replicated topic (bottom right)

Producing and consuming messages on the replicated topic can be done exactly as it has already been shown for the single topic. The following image shows the usage of  producer and consumer scripts execution

05-kafka-three-brokers-console-topics

The three Kafka brokers (top and bottom left) and the production/consumption of messages in a replicated topic (bottom right)

References


Viewing all 108 articles
Browse latest View live